Introduction
Splunk is a machine data search, tracking and analysis software that helps organizations discover, extract and exploit the full hidden potential of their data. As such, its fields of application are virtually infinite, insofar as each of our actions today can generate information for analysis.
I propose to prove this with a concrete example of Splunk's application in a very specific field: human behavior analysis.
Observation: A street with poor visibility, insufficient width for two cars to pass each other, no sidewalk for residents leaving their homes, a speed limit of 30 km/h, and yet many motorists drive far too fast and obviously commit repeated offences.
Action: Request to the commune to implement appropriate safety measures.
Results: After more than a year, still no action implemented.
Idea: If the decision-makers don't take any corrective action, it's because they don't have the evidence to prove it's necessary, and there's nothing to compel them to do so or to treat it as a priority.
To move the situation forward, it would be ideal if I could measure and analyze the situation myself, so as to present it in a more factual way than a simple statement such as "we find that cars drive fast on this street".
The only concrete proof that respects the General Regulation on the Protection of Personal Data would be to measure the speed of vehicles without identifying them or their drivers, in order to quantify and expose in a factual way the deviant behavior of certain motorists.
Concept
The objective is as follows: generate vehicle speed data so that it can be collected and used in Splunk. The sine qua non condition is to be able to measure speed in a simple, inexpensive way, without the need for police radar.
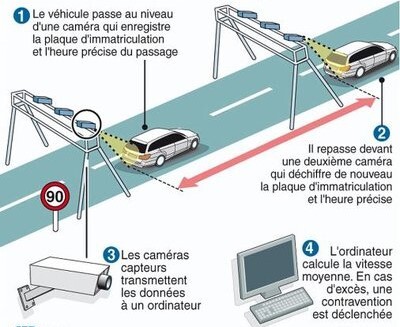
As we all know, speed is the quantity defined by the time taken to perform an action (in this case, to cover a certain distance). Luckily, I have an ideal environment at my disposal: two ground-floor windows facing the same direction, positioned on the same wall directly adjacent to the street, at the same height, and at a distance of several meters from each other.
- As this distance is fixed and measurable, it is sufficient to time the time taken to cover it in order to determine the speed, in the same way as a speed camera:
-
Disadvantages :
-
This system can only calculate the average speed over this section. However, given the short distance covered, it can be considered almost equal to the instantaneous speed.
-
RGPD oblige (to better understand the principles of personal data protection, here is another article from our blog: https://www.algosecure.fr/actualites/article/rgpd-conservation-donnees-personnelles), I won't be able to use cameras either, so I won't be able to 100% guarantee that two detections correspond to the same vehicle, or even that it's a vehicle at all.
Accepted: The aim is not to build a perfect, approved radar. For me, the priority is to have data that can be used quickly and simply, even if it's an estimate. Accuracy can always be improved later if necessary.
-
-
Advantages :
-
Simple, provided you can time the journey
-
Based on the chronological order of detections, I'll be able to deduce the direction of traffic so as to take this parameter into account in my statistics. One of the hypotheses I'd like to validate is that vehicles drive faster and speed more when entering the village than when leaving it. There's a simple reason for this: the topology of the street offers better and longer visibility in that direction. If I can prove that one particular direction of traffic is more prone to speeding than another, then this would help decision-makers to make more pertinent choices about how to improve this situation more effectively.
-
To measure time travelled, we need to automatically detect when a vehicle passes two reference points (in this case, my two windows). One solution offers a very good compromise between simplicity, cost and efficiency: sensors.
I don't need to deport the calculation anywhere other than Splunk: all I need is for my two reference points to tell me the exact moment at which they detect movement, and for me to retrieve this data.
- If I can get these time values, then I can deduce the duration.
- Having already fixed the distance, I'll deduce the speed, whose most relevant unit of measurement will be the number of meters per second.
- I'll then simply convert it into kilometers per hour using the following calculation: there are 1,000 metres in a kilometer and 3,600 seconds in an hour, so $1 m/s = $(1/1000) / (1/3600)$ = $3600 / $1,000 = $3.6 km/h.
- I would then have the time and speed of the vehicles in Splunk, and just have to exploit it.
The detection system
Constraints
I have to manage the detections myself and send them to Splunk, time-stamping the information transmitted.
- This means that no matter how long it takes for the data to be received, it is the time indicated in the information that is decisive, not the time of receipt.
As the two measurement points are several meters apart, I need two independent detection systems, and I need to synchronize them in time.
Finally, I'd like to work on an open-source solution for budgetary reasons and to give everyone the chance to take over and improve it.
Equipment
With my Splunk server already in place, configured and running, this point is already taken care of, and the choice of hardware will focus solely on the vehicle detection system.
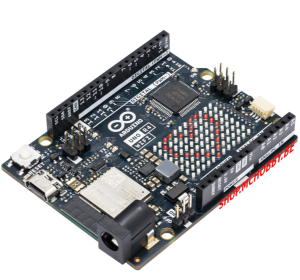
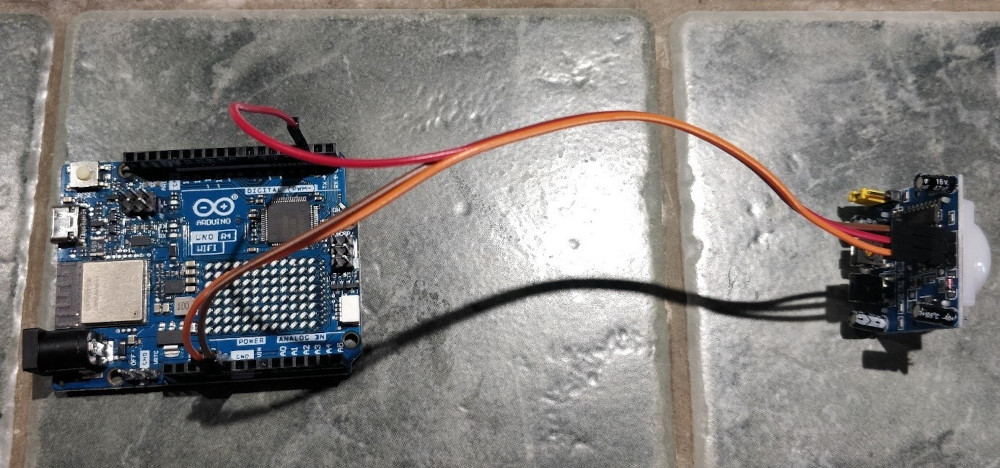
Since I've decided to use sensors, the open-source components that will enable me to manage them autonomously and inexpensively, while leaving me complete freedom in terms of the code executed, are Arduino boards.
- The aim is for the data to be collected in Splunk, so it has to travel over the network to my server.
- Although it's possible to use a wired connection with an RJ45 cable for communication from an Arduino via a specific component (Shield Ethernet), I don't really feel like buying and installing meters of cable between my rooms and my office.
- I'm therefore going to opt for a wireless connection, with boards that directly support this mode of communication: Arduino R4 Wifi boards.
As far as connectors are concerned, I already have the necessary wires to link the sensors to the boards.

In terms of sensors, my choice is the HC-SR501 infrared model:
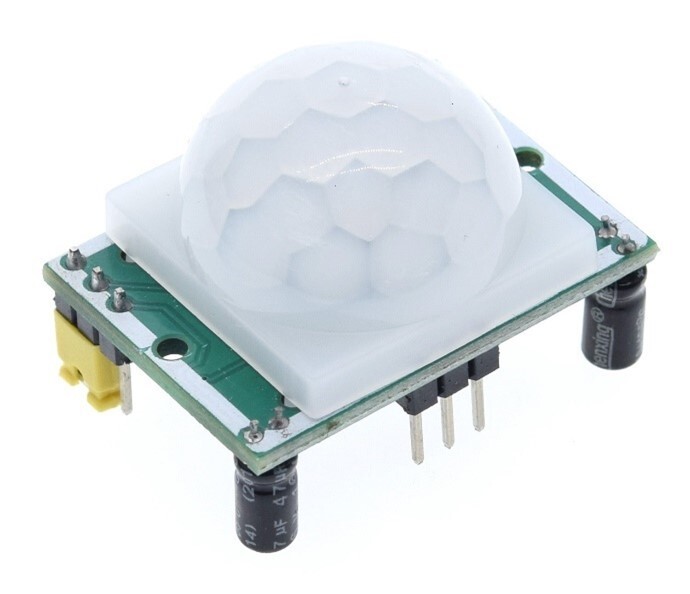
Key features :
- Detection range : 110 degrees
- Distance detection : up to 7 metres
- Blocking time : 2.5s by default
- Adjustable sensitivity and time delay
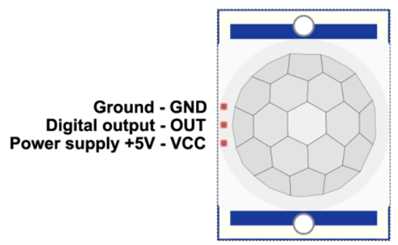
Simply connect the sensor to the Arduino board as follows:
| Sensor pin | Arduino pin |
|---|---|
| VCC | 5V |
| OUT | D2 (your choice) |
| GND | GND |
Arduino code
Constraint n°1: time
The first essential thing we had to determine was how to synchronize the two Arduino boards at time level. Basically, the boards have no knowledge of what time it is. The only time component in their possession is the number of milliseconds elapsed since they started running the current program, which is reset after around 50 days (this value can be retrieved via the millis() function).
Problem: it is impossible to start both boards at the same time to the nearest millisecond, so this value is unusable.
Solution: The cards are connected to the Wifi network, so they can access the Internet.
- There's a well-known protocol for synchronizing the local clocks of machines via the network: NTP (Network Time Protocol).
- My cards will then be able to retrieve and transmit this time, which will always be correct, even if we live in a country that changes time twice a year.
- All I need to do now is find a way to have my cards interrogate the same NTP server so that they synchronize with it at the same time.
- Fortunately, as Arduino's are open-source, libraries generally exist for every need, including this one with the
ezTimelibrary.
Constraint n°2: sending data to Splunk
Arduino boards don't have an operating system, so they can't host a pre-packaged Splunk agent.
- Fortunately, there are many other collection methods in Splunk.
- One of these methods, already tried and tested in my professional context, is the use of the HEC (HTTP Event Collector), which sends data to a Splunk instance via the HTTP/HTTPS protocol.
- All I need to do now is find a way for my cards to send the data received from the sensors in HTTP packets to my Splunk server, which will be configured beforehand to collect and index them correctly.
- Exceptionally, I won't secure the flow via HTTPS because I'm not transmitting any sensitive data and I'm working on a personal basis.
Constraint n°3: sensor identification
In order to be able to analyze the duration and order of detections, I need to reliably and uniquely identify the sensor communicating its data. It's possible to manually specify the value of the "host" metadata identifying the source of the data in Splunk, but I want to have a single code for all my sensors and use a single data entry for all my Arduino boards.
- The chosen solution is to use the last byte of the IP address returned by my DHCP server to the cards.
- I know that my Wifi network uses a /24 mask, providing up to 254 potential IP addresses available between X.X.X.1 and X.X.X.254. The last byte will therefore always be unique.
- All I have to do is have my DHCP server assign a static address to each of my cards to ensure that they never change even after rebooting, and then retrieve and use the last byte assigned to forge a unique name for each card.
Algorithm and code structure :
All code creation requires two things first:
- Know the program structure for the language used
- Think about the algorithm needed to meet the requirement
The structure of Arduino code has many elements in common with other, more complex languages:
- Bookseller import (optional if not used)
- Creation of global variables and constants (optional)
- Functions (optional)
- Setup" section:
- Identified by the setup() function
- Executed directly after board startup
- Executed once and only once
- Used to initialize variables, board pin modes and start using libraries
- Loop" section
- Identified by the loop() function
- Executed directly after the setup() part
- Executed in infinite loop
- Used to carry out the application's main operations
The algorithm envisaged for my needs based on this structure will therefore be as follows:
-
Import of libraries required for Wifi connection, NTP synchronization and HTTP transmissions
-
Creation of global variables and constants
-
Setup section with :
- Connect to my Wifi network
- Recover last byte of IP address to forge card name
- Set NTP update time and frequency
- Initialize pin 2 on the board to read sensor data
-
Loop part with :
- Reading sensor data
- If motion is detected: forge and send the data to Splunk, then reset the sensor and wait for it to return to its initial state.
- Otherwise do nothing
Here is the code finally used by each Arduino board:
// Importing libraries

// NTP
#include <ezTime.h>

// Wifi connection
#include <WiFi.h>

// Sending HTTP packets
#include <ArduinoHttpClient.h>

// Dedicated file containing my sensitive data (SSID, Wifi key, IP address of my Splunk server, and authentication token)
#include "arduino_secrets.h"

// Wifi parameters retrieved from arduino_secrets.h
char ssid[] = SECRET_SSID;
char pass[] = SECRET_PASS;

// Splunk connection parameters retrieved from arduino_secrets.h
char splunkindexer[] = SPLUNK_IDX;
char collectorToken[] = SPLUNK_TOK;
int port = 8088;

// Initialize the variables I'll need later on

// For Wifi connection
WiFiClient wifi;
int status = WL_IDLE_STATUS;

// For NTP
Timezone France;
// To connect to Splunk
HttpClient client = HttpClient(wifi, splunkindexer, port);

// For spindle and sensor status
int sensorPin = 2;
int sensorState = LOW;
int sensorValue = 0;

// For items to be sent to Splunk
String date;
String eventData;
String host;

// Function used for sending to Splunk
void splunkpost(String collectorToken,String PostData, String Host)
{
  // Display data to be sent
  Serial.println(PostData);

  // Inclusion of events to be sent in the HTTP packet
  String postData = "{ "event": \"" + PostData + "\"}";

  // Authentication via token
  String tokenValue="Splunk " + collectorToken;

  // Client initialization
  client.beginRequest();

  // Definition of the URL to contact for HTTP POST transmissions
  client.post("/services/collector/event");

  // Definition of the various HTTP packet headers
  client.sendHeader("Content-Type", "application/application/json");
  client.sendHeader("Content-Length", postData.length());
  client.sendHeader("Host", Host);
  client.sendHeader("Authorization", tokenValue);

  // Data inclusion
  client.beginBody();
  client.print(postData);

  // End of request transmission
  client.endRequest();

  // Read and display return code and response body
  int statusCode = client.responseStatusCode();
  String response = client.responseBody();
  Serial.print("POST Status code: ");
  Serial.println(statusCode);
  Serial.print("POST Response: ");
  Serial.println(response);
}

// Setup section
void setup() {
  // Set the data rate in bits per second (baud) for data transmission on the board's serial monitor.
  Serial.begin(9600);

  // Wifi connection with serial information display
  while ( status != WL_CONNECTED) {
    Serial.print("Attempting to connect to Network named: ");
    Serial.println(ssid);
    status = WiFi.begin(ssid, pass);
  }

  // Retrieve and display allocated IP address
  IPAddress ip = WiFi.localIP();
  Serial.print("IP Address: ");
  Serial.println(ip);

  // Use last byte to set unique host name
  host="sensor "+String(ip[3]);

  // Set the NTP server to contact, synchronization frequency and display synchronization events
  setServer("ntp.unice.fr");
  setInterval(60);
  waitForSync();
  setDebug(INFO);

  // Setting the timezone, essential for getting the right time
 France.setLocation("Europe/Paris");

  // Set the sensor pin to input mode and send the first data to Splunk to validate the initial communication.
  pinMode(sensorPin, INPUT);
  eventData="Initializing System...";
  splunkpost(collectorToken,eventData,host);

  // Pause for 5s to give sensor time to initialize
  delay(5000);
}

// Loop part
void loop() {
  // Recurrent NTP synchronization at the defined frequency
  events();

  // Read sensor value
  sensorValue = digitalRead(sensorPin);

  // If the sensor has detected movement
  if (sensorValue == HIGH) {
    // If the sensor had not detected anything before
    if (sensorState == LOW) {
      // Forge the data to be sent with the date in milliseconds
      eventData=France.dateTime("d-m-Y H:i:s.v") + " - Motion detected !";
      // The data is transmitted using the created function
      splunkpost(collectorToken,eventData,host);
      // Set sensor status to detection
      sensorState = HIGH;
      // Wait 1s for start of timer
      delay(1000);
    }
  }

  // If the sensor status variable is in detection mode
  if (sensorState == HIGH) {
    // We wait another 1s
    delay(1000);
    // We set our state to non-detection mode to make the following reading
    sensorState = LOW;
  }
}
Collection in Splunk
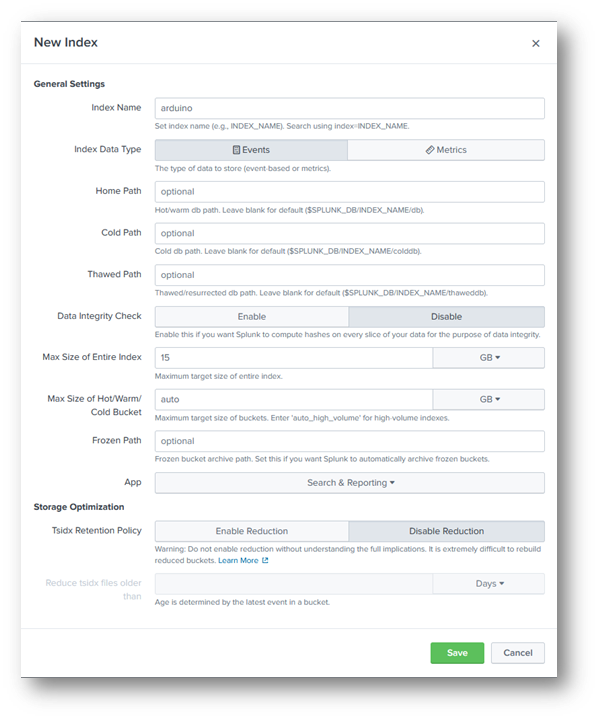
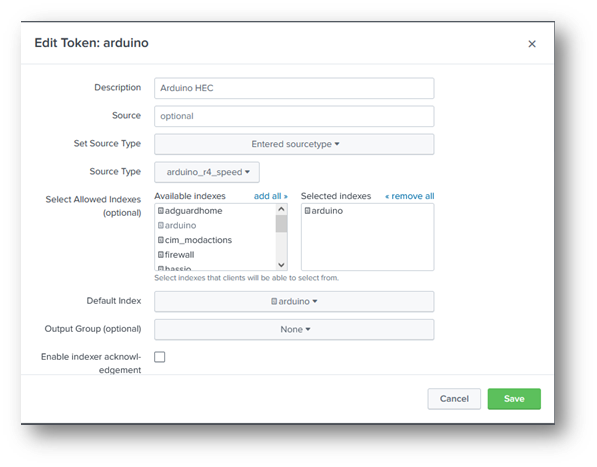
As the entire configuration of a Splunk server is already documented on the publisher's website, I'll just indicate the configuration required for data input from my Arduino boards:
- An index to receive, compartmentalize and store the Arduino data that I will be able to query:
- An HTTP Event Collector entry with an authentication token to receive data transmitted by the Arduino on a specific port (TCP 8088 by default) and store it in the previously created index:
Results
On the map
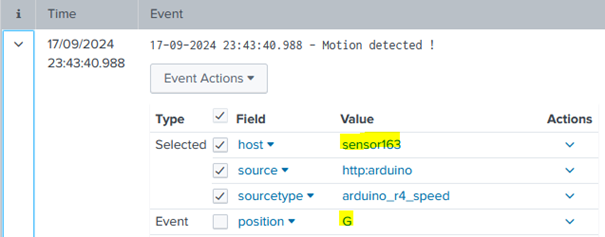
Once the code has been downloaded to the card, the following data is displayed on the serial monitor (with the generation of a movement in front of the sensor):
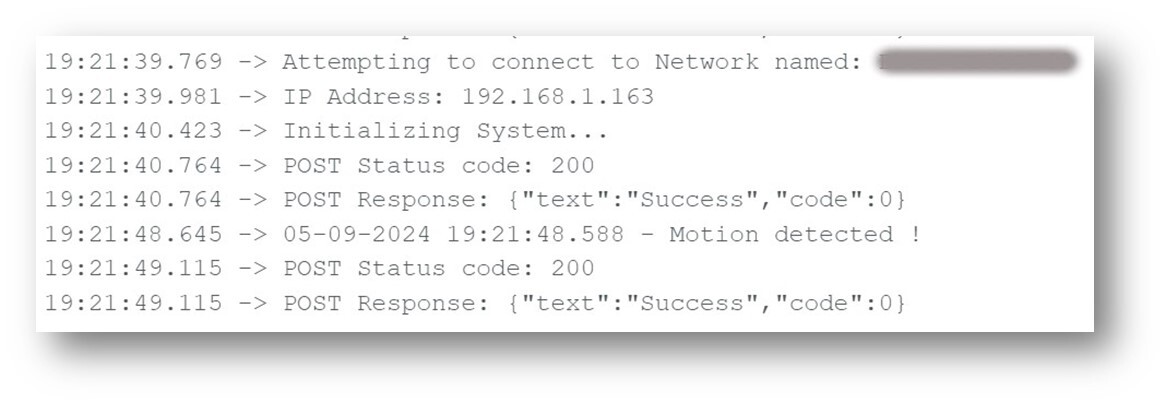
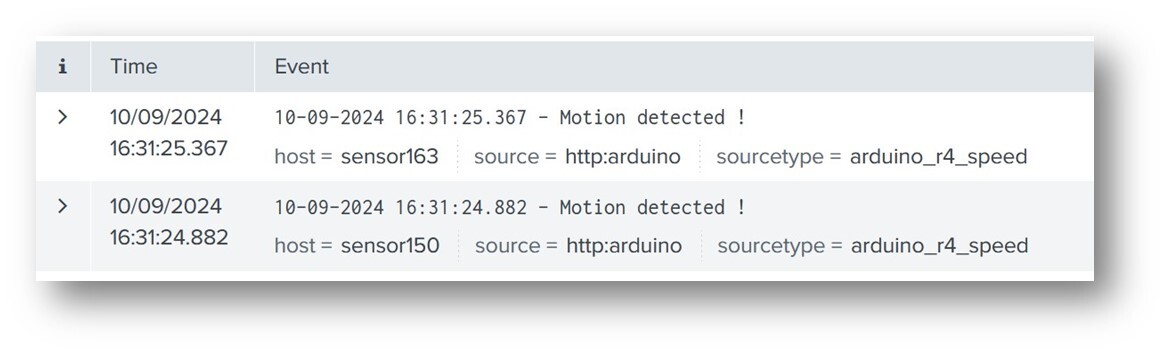
Each time the sensor moves, I get the time and the notification sent to Splunk with an HTTP 200 (OK) return code.
In Splunk
Searching the index for the period in question, I find the data from my two boards uniquely identified (the logs below are obviously different from those previously displayed on the Arduino board's serial monitor):
So I've got the data generated by my sensors, transmitted by my Arduino boards, received and stored in my Splunk server. All that's left to do now is to exploit and analyze it, but before I can do that, I need to solve a problem first.
Sensor adaptations
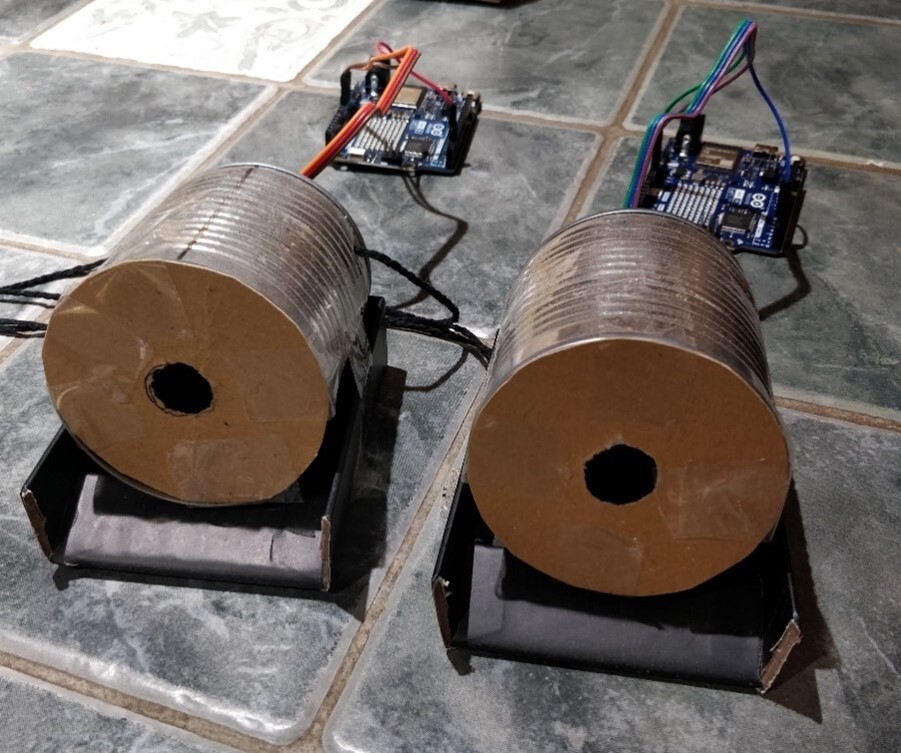
Initial tests were conclusive in an indoor environment, but when I carried them out in real street conditions, I found a high rate of false positives, with detections without any vehicle being present. The reason is as follows: infrared motion sensors operate with a wide detection beam (110 degrees for this model of sensor).
- In my living room, there was no movement other than the ones I triggered myself for my function tests.
- In the street, it's quite different: the wind moving the leaves, a bird landing on a low wall, a plastic bag twirling poetically... Movements are diverse and varied, and each one is detected by my sensors.
- If I want to limit this phenomenon and concentrate on the movements that interest me, then I have to restrict the sensor beam myself, so that only a limited area is monitored.
Unfortunately, I can't reduce the beam angle at the sensor like I can the range and time delay, which can be changed with a screwdriver on small potentiometers.
- So I'm going to have to obstruct the sensors quite finely to limit the beam to a restricted area.
- Constraint: this obstruction must be strictly identical between my two sensors to avoid any difference in behavior between them.
So I improvised with the elements at my disposal:
- Two identical empty cans
- Pieces of the same cardboard
- Four identical paper clips
- Patafix
- A hammer and some nails
The idea from these elements:
- Lock my sensors in the bottom of cans
- Secure them with unfolded paper clips acting as wires, also providing other holes for the connector wires to the Arduino board.
- Cut out cardboard circles of the same diameter as the boxes
- Cut a small hole in them
- Tape these to block the openings
As everything has to stand still, I add two identical small packaging lids to act as stable supports on which to tape the boxes.
Result :
Thanks to Angus for teaching me that there's always a surprising solution to any problem!

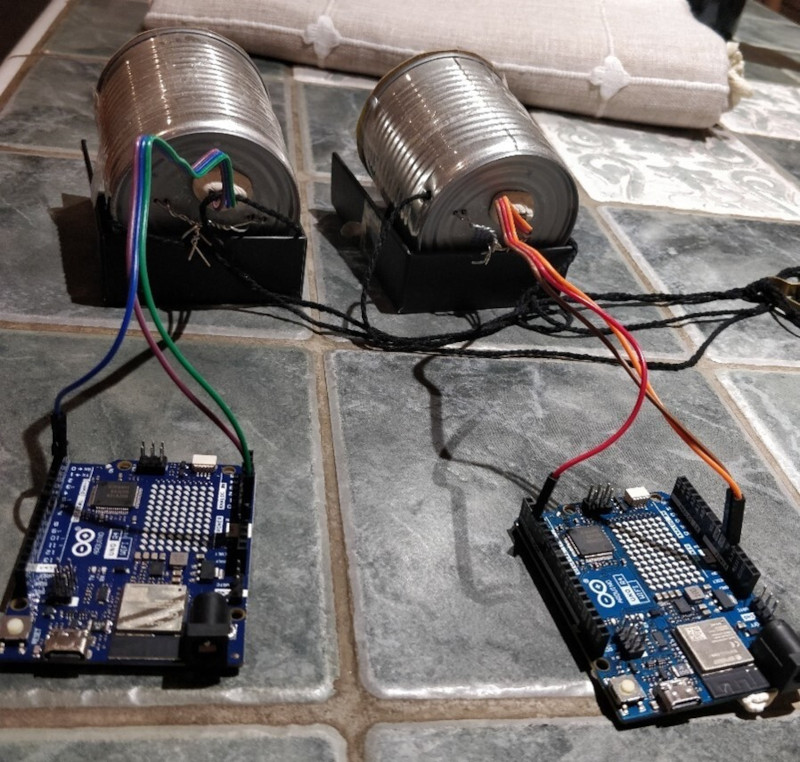
After installing them on the window sills, the detections were immediately more relevant: no more spurious motion detection and only those of objects passing exactly in front of the sensors (even if this includes elements other than vehicles, such as pedestrians, but I'll deal with these false positives in my Splunk calculations).
Data processing
Once the data is in Splunk, and the fields have been extracted (although in this case I didn't have to perform this step, as I only needed the time of the event and the identity of the source card), it can be exploited, manipulated, formatted and enriched using Splunk's query language: SPL (Search Processing Language).
As this language is documented on the publisher's website, I'll just describe the query process step by step, to illustrate how, in successive stages, we start with raw data and end up with data formatted in Splunk :
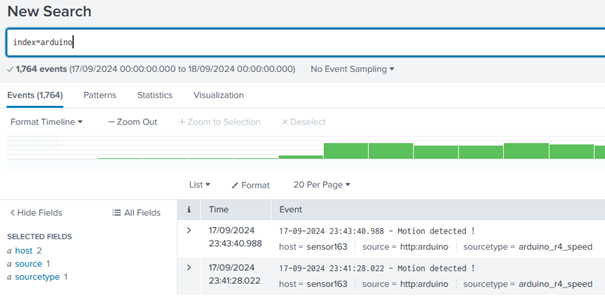
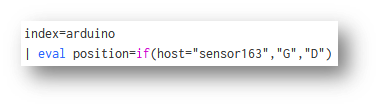
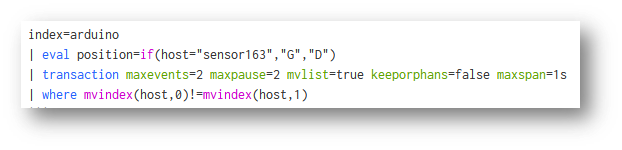
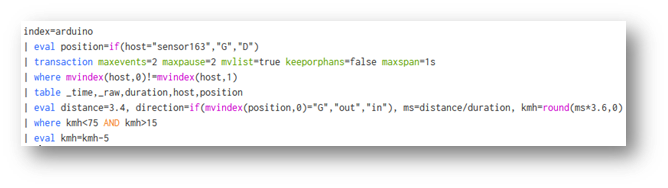
- I query the relevant index for the period I'm interested in:
- I'll now define which sensor is at which position:
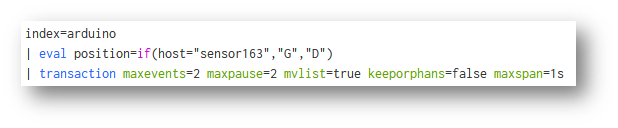
- I group the events in packs of two, based on the principle:
- There is a maximum 2-second pause between vehicle passages (because the time delay between each measurement is set in the Arduino board code).
- That there is a maximum delay of 1s between each event in the same block (because if an element takes more than a second to cover the distance between the two windows, this corresponds to a speed of less than 12km/h, which is certainly a false positive as no car drives that slowly down the street).
- The big advantage of this command is that it directly calculates the duration between the oldest and most recent event in the block.
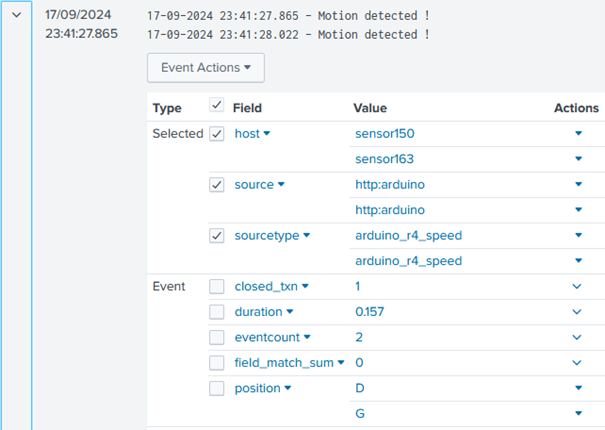
- I only keep blocks with two different sensors in case :
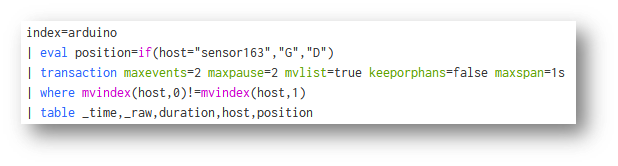
- I start generating a table with the data I'm interested in:

- I enter the distance between the sensors, and begin my calculations: depending on the order of the sensors, I deduce the direction, and depending on the duration, I deduce the speed in m/s, which I then convert into km/h :
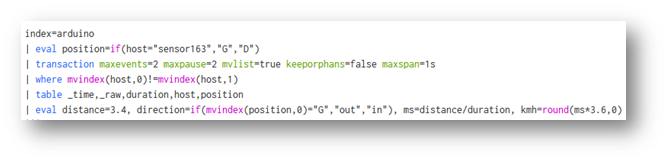
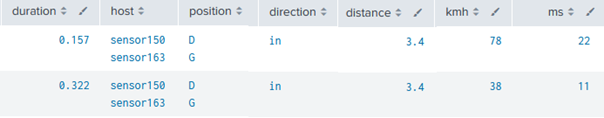
- I keep plausible speeds between 15 and 75 km/h and subtract 5 km/h from the calculated value to include the same margin of error as approved radars:
- I go to www.service-public.fr and identify the following elements according to the level of infringement:
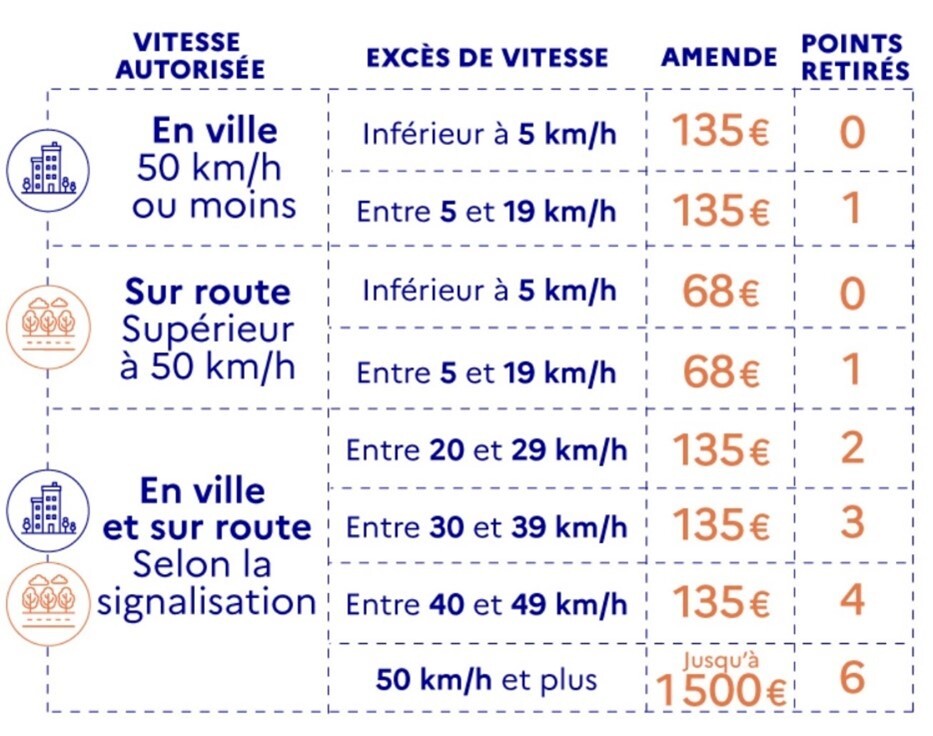
- So I know that in my context, fines will only be €135, whatever the level of offence, and the number of points will depend on the different speeding thresholds.
- I exclude the last case of 50 km/h and over because it is not one of the plausible values in my context.
- I therefore set these elements according to the measured speed, knowing that the limit is 30 km/h :
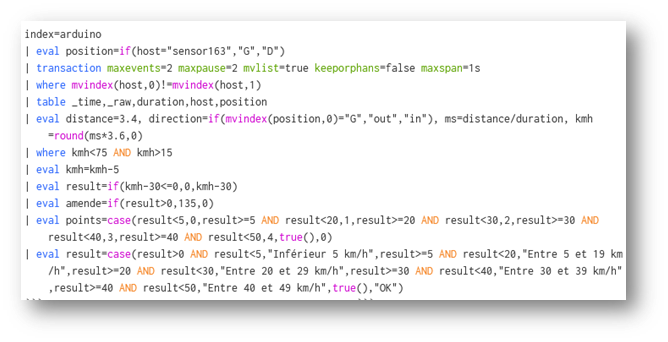
- I keep only the fields I need for analysis:

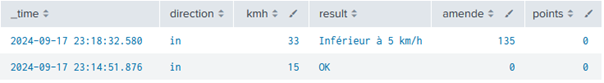
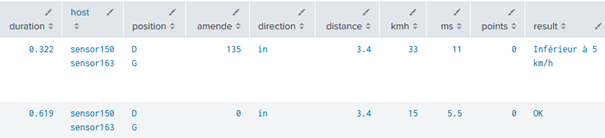
From several simple motion detection logs, we end up with :
- Time of passage in front of the two sensors
- Speed in km/h measured and lowered to match the operation of approved radars
- The object's direction of passage
- The level of offence for speeding over 30 km/h
- The fine corresponding to the offence
- The number of points deducted for the offence
- Elimination of as many false positives as possible, keeping only plausible speeds that could correspond to those of a vehicle in my context.
All that remains is the final processing stage, the one that highlights the value of the data and makes it accessible to everyone: dashboarding!
Dashboard and analysis
In the same way as the SPL language, the idea is not to show the entire configuration of a Splunk dashboard, but to show how it is possible, from a technical datum, to arrive at a result that is much more visual, accessible and interpretable by all.
Here are the various elements of the dashboard created, deliberately separated for better readability, and over a representative analysis period of 24 consecutive hours:
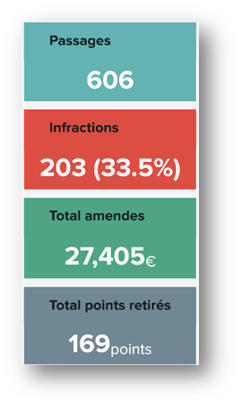
The data speak for themselves:
- One third speeding (despite 5 km/h reduction)
- More than €27 k in fines and almost 170 points deducted on the day
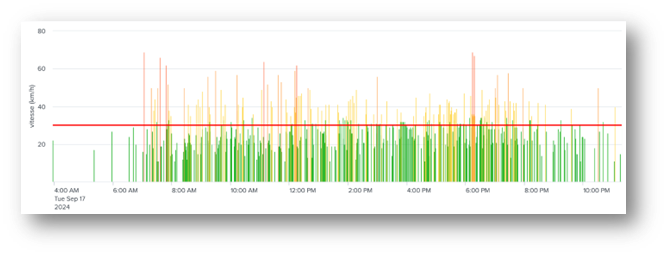
- The most serious offences are generally committed in the morning, around midday (lunch breaks) and in the late afternoon (return from work).
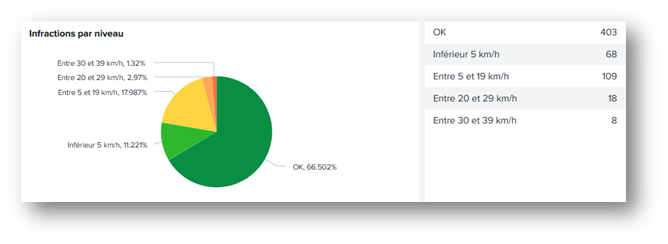
The majority of offences are between 5 and 19 km/h over the speed limit (i.e. between 35 and 49 km/h).
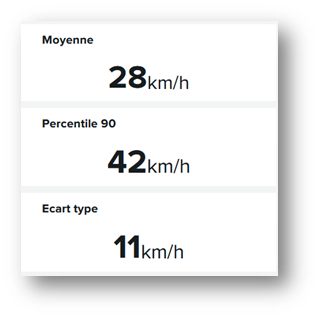
The average speed is close to the authorized limit.
But the 90th percentile is more than 10 km/h higher, which means that one person in ten drives at more than 42 km/h.
The standard deviation is 11 km/h, which corresponds to the dispersion of the data around the mean value: this highlights the differences in behavior between motorists. A low standard deviation would indicate that a large proportion of drivers are driving at a speed close to the mean value (28 km/h on this day). The higher the standard deviation, the more dispersed the values.
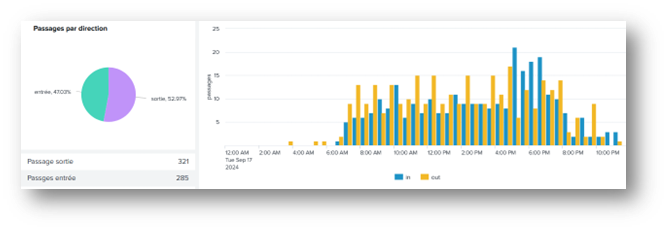
There are slightly more people leaving the village than entering.
The number of entries rises sharply in the late afternoon (certainly due to people returning from work), while exits are more spread out over time.
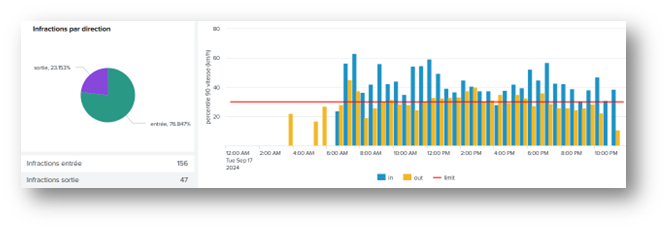
Despite the higher number of crossings on the outskirts of the village, more than 76% of offences are committed in the opposite direction, regardless of the time of day.
The level of speeding offences at the entrance to the village is much higher than in the opposite direction.
This confirms my hypothesis that the topology of the street is more conducive to deviant behavior in this direction.
Conclusion
The creation of this project has enabled me to validate several hypotheses concerning the behavior of motorists and their associated causes.
The objectives I had set myself included:
- To be able, at my own level and with the means at my disposal, to meet this need for analysis on my own.
- To prove that imagination is the only limit to Splunk's scope of application, as long as it can be given data to exploit.
I've fulfilled the first objective, and I dare to hope that I've also succeeded in fulfilling the second for those who have had the courage to read me so far 😊!
Happy Splunking!
Areas for improvement
Like all projects, this one isn't perfect... Not as far as Splunk is concerned (obviously), which does an excellent job of collecting and exploiting data, but as far as the detection system is concerned, which is still at the tinkering stage and has some not inconsiderable flaws:
Time accuracy
The most important of these is time synchronization between Arduino boards. In fact, despite my best efforts to solve this problem, any machine perpetually goes out of sync by a few milliseconds, even when querying an NTP server every minute. This usually has no impact, but in this case, the slightest shift has a huge impact on my measurements.
Example :
At 50 km/h, which corresponds to 13.9 m/s, the travel time for my 3.4m distance is $3.4/13.9 = about $245 ms.
- If my cards are 50 ms out of sync with each other, I'll read a duration of $195$ms or $295$ms, depending on the direction of desynchronization.
- At $195$ms, my speed calculation result would be $17.4$ m/s = $63$ km/h, against $11.5$ m/s = about $41$ km/h at $295$ms, both versus a real speed of 50 km/h.
Unfortunately, I can't guarantee the reliability of my measurements at this stage, as the margin of error is far too large.
- At most, they reflect a trend that cannot be interpreted as the actual values of a certified radar.
Solutions :
-
Reduce the impact of time shifts by increasing the distance covered.
- But this won't solve the problem of map desynchronization, and as distance increases, average speed will be less and less close to instantaneous speed.
- In any case, this solution is impossible in my case because my environment does not allow for more distance.
-
Modify the system by making it synchronous via two sensors connected to a single board.
- This is the best solution, because regardless of the card's desynchronization with the NTP server, both sensors would use a single time base for their detections.
- In addition, this would make it possible to delegate all the work of calculating and sorting out false positives to the Arduino board at the level of its own code:
- If I see a detection from one sensor, then I wait for the second.
- If the second one doesn't see anything, then it's a false positive, so I ignore it and start again.
- If the second one also detects a movement, I calculate the exact time between the two and send it to Splunk, or even check if it's a plausible value before sending it.
The data would therefore arrive in Splunk already purified, and its volume would be halved as it would only receive the durations already calculated, and not the motion detections of each sensor.
- As the distance is variable depending on how the sensors are positioned, it can be modified within the Splunk request to adapt to each context without having to systematically change the Arduino code.
Unfortunately, this solution can't be implemented in my context either. I've got lots of walls and a corridor, which would mean pulling meters of wire from my sensors to connect them to a single board.
- What's more, I can't imagine connecting my sensors to a board positioned between the two from the outside either, as the whole thing would be in plain sight, unprotected and at the mercy of the elements.
If I ever change my measurement environment, I'll be able to consider implementing this improved version of the detection system.
Sensor precision
Using infrared sensors that I have deliberately obstructed to limit the detection range, this is inevitably imperfect. In particular, I found that some vehicles were driving so fast that the sensors didn't have time to detect their passage.
Similarly, the sensors have a time delay that I've limited to 2 seconds between each measurement, so a movement occurring less than 2 seconds after another will not be detected.
- The results are therefore not completely exhaustive in terms of detections.
Solution: Use much more precise and responsive sensors, such as laser sensors with reflectors.
- Unfortunately, it's impossible to implement in my current environment.
Quality of equipment
Other areas for improvement are evident in the finishing of the detection system, which is still made from bits and pieces for my tests, without even having soldered the wires with my Arduino boards.
A clean, sturdy, waterproof product would still be more presentable than cans with wires running down to a board connected to an extension lead...
Sources
- How to build a car speed sensor with Arduino : https://www.moussasoft.com/comment-construire-detecteur-de-vitesse-arduino/
- How to use the HC-sr501 PIR motion sensor with Arduino : https://idehack.com/comment-utiliser-le-capteur-de-mouvement-pir-hc-sr501-avec-larduino/
- How to use HC-SR501 PIR Motion Sensor with Arduino : https://www.makerguides.com/hc-sr501-arduino-tutorial/
- ARDUINO and 9V battery : NO! : https://forum.arduino.cc/t/arduino-et-pile-9v-non/700342
- ezTime, an Arduino library for all of time : https://github.com/ropg/ezTime
- Arduino, Meet Splunk : https://medium.com/hackernoon/arduino-meet-splunk-81f32e252f9c
- Driving speed : https://www.service-public.fr/particuliers/vosdroits/F19460
À propos : Le blog d'AlgoSecure est un espace sur lequel notre équipe toute entière peut s'exprimer. Notre personnel marketing et commercial vous donne des informations sur la vie et l'évolution de notre société spécialisée en sécurité sur Lyon. Nos consultants techniques, entre deux tests d'intrusion ou analyses de risque, vous donnent leur avis ainsi que des détails techniques sur l'exploitation d'une faille de sécurité informatique. Ils vous expliqueront également comment sécuriser votre système d'informations ou vos usages informatiques particuliers, avec autant de méthodologie et de pédagogie que possible. Vous souhaitez retrouver sur ce blog des informations spécifiques sur certains sujets techniques ? N'hésitez pas à nous en faire part via notre formulaire de contact, nous lirons vos idées avec attention. Laissez-vous guider par nos rédacteurs : Alessio, Alexandre, Amine, Anas, Arnaud, Benjamin, Damien, Enzo, Eugénie, Fabien, Françoise, Gilles, Henri, Hicham, Jean-Charles, Jean-Philippe, Jonathan, Joël, Joëlie, Julien, Jéromine, Lucas, Ludovic, Lyse, Matt, Nancy, Natacha, Nicolas, Pierre, PierreG, Quentin, QuentinR, Sébastien, Tristan, Yann, Yannick, et bonne visite !